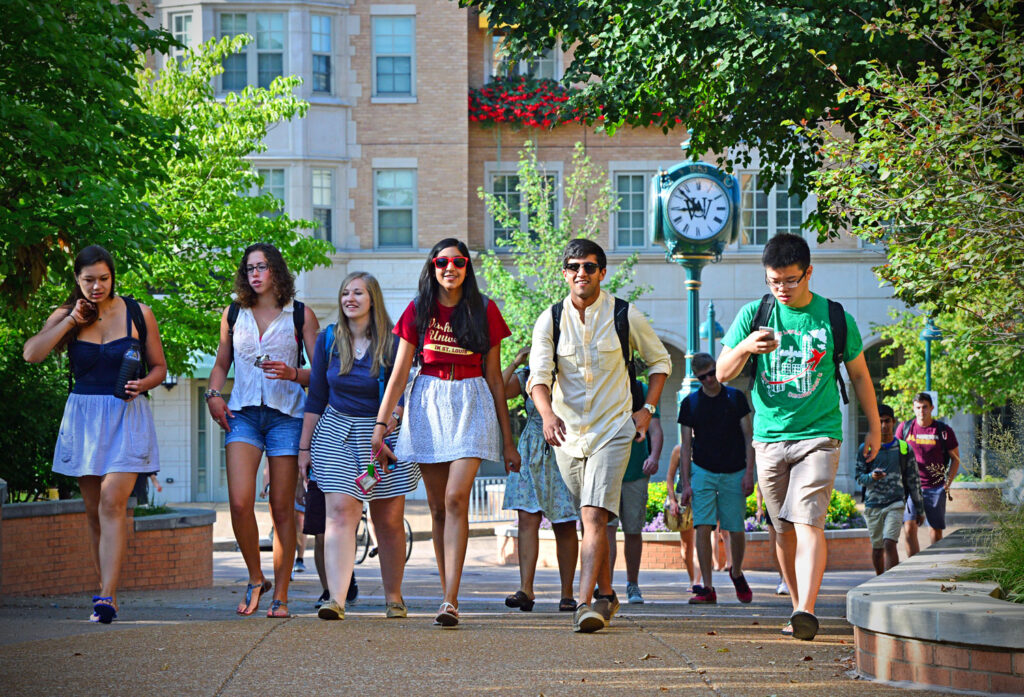
Washington University in St. Louis values the diversity of its student body, which adds complexity to student learning and the student experience.
Fall 2025 – 10th Week
Sex
| Undergraduate | Graduate | Total University | |
|---|---|---|---|
| Female | 55.2% | 48.5% | 51.9% |
| Male | 44.4% | 49.6% | 46.9% |
| Not Declared | 0.4% | 1.9% | 1.1% |
| X-Non-Binary | 0.1% | 0.0% | 0.1% |
Race / Ethnicity
| Undergraduate | Graduate | Total University | |
|---|---|---|---|
| Hispanic | 12.0% | 5.7% | 8.9% |
| American Indian | 0.1% | 0.1% | 0.1% |
| Asian | 21.1% | 8.4% | 14.9% |
| Black | 8.9% | 5.4% | 7.2% |
| Pacific Islander | 0.1% | 0.0% | 0.1% |
| White | 39.0% | 32.2% | 35.7% |
| Two or more races | 5.9% | 2.9% | 4.4% |
| Unknown | 2.5% | 2.8% | 2.7% |
| International | 10.4% | 42.4% | 26.0% |
Undergraduate Pell Eligible Enrollment
As of Fall 2025 10th Week 22% of enrolled undergraduates receive Pell grants.
More Information
Additional institutional data, including student diversity, is published in collaboration with the Office of the Provost and the Director of Institutional Research and Analysis.
